Skip to content
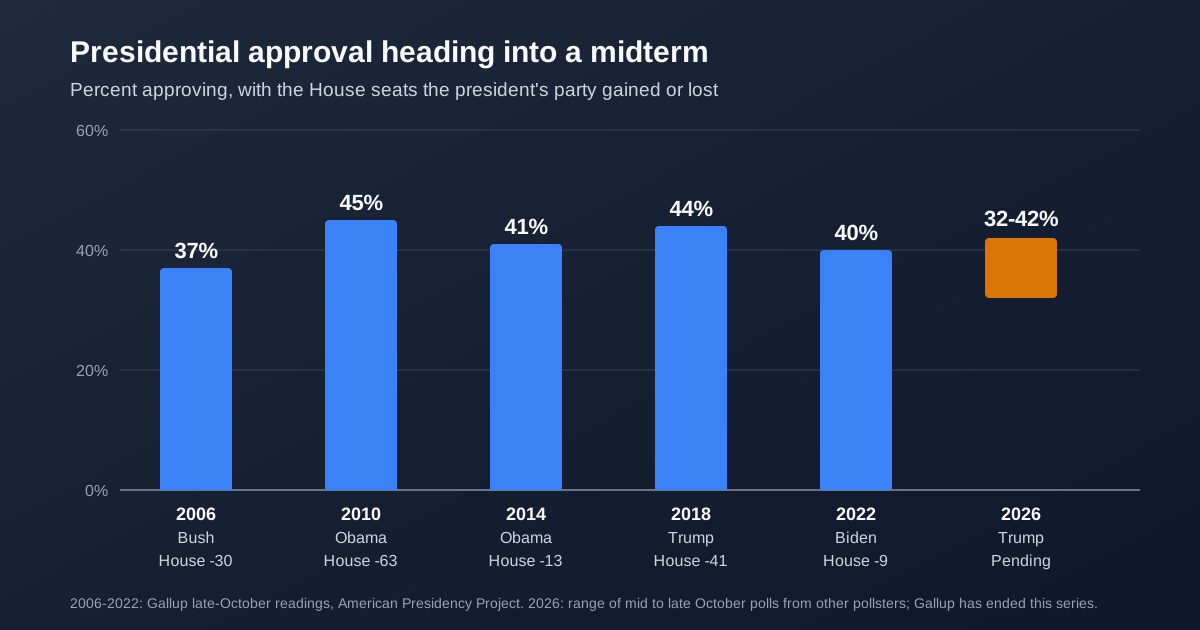
Bar chart of presidential approval in late-October Gallup readings before the 2006, 2010, 2014, 2018 and 2022 midterms with House seat changes, beside the 32 to 42 percent range of late 2026 polls
|7 min read

Trump's Approval Rating on Election Day 2026: How It Compares to Past Midterms

Trump's approval runs from 32% to 42% in late midterm polls. Why the numbers differ, how they compare with 2006 to 2022, and what they can't predict.

Where Trump's Approval Stands

Heading into today's midterms, President Trump's approval sits between the low 30s and low 40s, depending on the poll, with disapproval in the high 50s to high 60s. The Silver Bulletin average, as reported by The Conversation on November 2, was 38.4% approve and 58.8% disapprove, a net rating of -20.4. That is up from a low of -24.3 on October 21, so he improved slightly in the closing stretch while remaining deep underwater. Every recent poll below shows him under the 44% he held in Gallup's late-October reading before the 2018 midterms, when his party lost 41 House seats. Voters are now deciding whether that history repeats. This post lists the final numbers, explains why they disagree, and sets them against the last five midterms. It does not try to predict tonight's results.

The Late Polls

Each line lists who was surveyed where the source states it, because that drives much of the difference. Rasmussen, Tufts, Harvard-Harris, The Economist, RMG, Washington Post-ABC-Ipsos and AP-NORC figures come from a USA Today Network approval roundup. NBC News, registered voters, Oct. 28-30: 40% approve, 60% disapprove Rasmussen Reports, dated Oct. 27: 41% approve, 58% disapprove Tufts, dated Oct. 27: 36% approve, 61% disapprove Harvard-Harris, dated Oct. 26: 39% approve, 59% disapprove The Economist tracker, dated Oct. 26: 39% approve, 58% disapprove Reuters/Ipsos, adults, released Oct. 26: 32% approve, one point above its record low RMG Research, dated Oct. 25: 42% approve, 57% disapprove NPR/PBS/Marist, registered voters, Oct. 19-20: 38% approve, 61% disapprove New York Times/Siena, registered voters, Oct. 12-19: 34% approve, 60% disapprove CNN/SSRS, adults, Oct. 15-18: 32% approve, 67% disapprove, a record low in that poll Washington Post-ABC-Ipsos, dated Oct. 18: 33% approve, 66% disapprove AP-NORC, dated Oct. 15: 36% approve, 64% disapprove For another average, the same roundup put the New York Times tracker at 37% approve and 60% disapprove as of October 29. Yahoo Finance reported a Silver Bulletin net rating of -22.6 calculated Sunday, while The Conversation reported -20.4 a day later. A two-point shift like that is a useful reminder that averages move when a new batch of polls arrives, and it is rarely a sign that opinion changed overnight. Gallup, long the standard source, is absent: it announced in February that it would stop tracking presidential approval, and its last published reading was 36% as of December 1, 2025. Time also cited a 30% reading from Pew Research Center in early October, the low point of his second term.

Why the Numbers Disagree

Who gets asked is the biggest factor. The clearest example comes from a single survey. The NBC News Decision Desk Poll of 19,135 adults, conducted September 28 to October 12, put Trump at 34% among all adults and 39% among registered voters. Same poll, same questions, five-point gap. Polls of adults tend to include more people who are disengaged from politics, and in this cycle those people are harder on Trump. Our explainer on likely voters versus all adults covers why that gap appears. Timing is the second factor. A poll fielded around the October 21 low can read lower than one from the final week. Method is the third. Pollsters differ in how they reach people and how they weight results to match the expected electorate, a process explained in our approval rating methodology guide and our look at house effects. So 32% and 42% can both be accurate descriptions of different groups at different moments. The trend within one pollster's series tells you more than any comparison across pollsters.

How It Compares With Past Midterms

The American Presidency Project compiles Gallup's readings through each midterm year. These are the late-October numbers and the House and Senate changes that followed for the president's party: 2006, George W. Bush: 37% approval, lost 30 House seats, lost 6 Senate seats 2010, Barack Obama: 45% approval, lost 63 House seats, lost 6 Senate seats 2014, Barack Obama: 41% approval, lost 13 House seats, lost 9 Senate seats 2018, Donald Trump: 44% approval, lost 41 House seats, gained 2 Senate seats 2022, Joe Biden: 40% approval, lost 9 House seats, gained 1 Senate seat 2026, Donald Trump: 32% to 42% in the polls above, results pending Because Gallup's series has ended, the 2026 line mixes other pollsters, so treat it as a rough comparison. Even so, a few conclusions hold. Trump is lower than he was before 2018 in every poll listed. Peter Enns of Cornell told Time, "This is historically low approval ratings for a President," and Time reported that Pew's 30% reading was the lowest for any president heading into midterms in decades.

Approval Does Not Convert Neatly Into Seats

Look at the table again and the relationship gets messy. Obama at 45% lost 63 House seats. Biden at 40% lost nine. Lower approval did not produce the larger loss. Gallup's long-run averages do show a broad pattern: presidents below 50% lost 37 House seats on average, compared with 14 for those above 50%. Within that low-approval group, though, outcomes range widely. Exposure is one reason. The same American Presidency Project table shows Democrats held 257 House seats going into 2010, leaving many in hard districts, while they held 222 going into 2022. A party with fewer seats has fewer to lose. Republicans hold about 218 today, so a loss on 2010's scale would be far harder to reach. The maps matter too: The Conversation's analysis estimates that Democrats need roughly a four-point national lead for a good shot at the House because of Republican gerrymanders, though the Silver Bulletin model makes them favorites at two to three points. Our redistricting guide explains how lines change that math. The Senate depends even more on which seats are up. Trump's party gained two seats in 2018 despite the House losses because Democrats were defending so many seats in Trump-friendly states. This year Republicans are defending most of the competitive ones.

Who Has Moved

NBC's final poll of 1,000 registered voters, with a margin of error of plus or minus 3.1 points, shows where the slippage is. Disapproval at 60% was a record high across both of Trump's terms in NBC polling. - MAGA Republicans: 93% approve. His core base has held. - Other Republicans: 54% approve, 46% disapprove. - States Trump won in 2024: 47% approve, 53% disapprove, about 10 points lower than his approval there in March 2025. - White voters without college degrees: net approval down 18 points since NBC's first poll of his second term. - Trump's own 2024 voters: about a third say he has fallen short of expectations. The larger NBC Decision Desk survey of adults shows lower numbers among groups that helped him in 2024: 21% among independents, 28% among men under 30 and 31% among Latinos, with 76% among Republicans. Those come from a different poll with a different population, so they should not be set directly against the numbers above. On congressional preference, the same final NBC poll has Democrats ahead 52% to 45%, and the Silver Bulletin average has them at +9.4.

The Issues Behind the Number

The Silver Bulletin's issue averages, as reported November 2, show where he is weakest and strongest: immigration at net -12.1, trade at -27.0, the economy at -28.6 and inflation at -44.2. An AP-NORC poll cited by Time found 26% approval on the economy and 17% on the cost of living. About three in four voters told NBC they are dissatisfied with the economy, and 53% of Republicans said the same. Foreign policy is a drag too. The Iran war polled at 35.9% support and 56.5% opposition in the same averages, and it returned to the headlines with the November 2 strikes on Qeshm Island.

What Approval Cannot Tell You

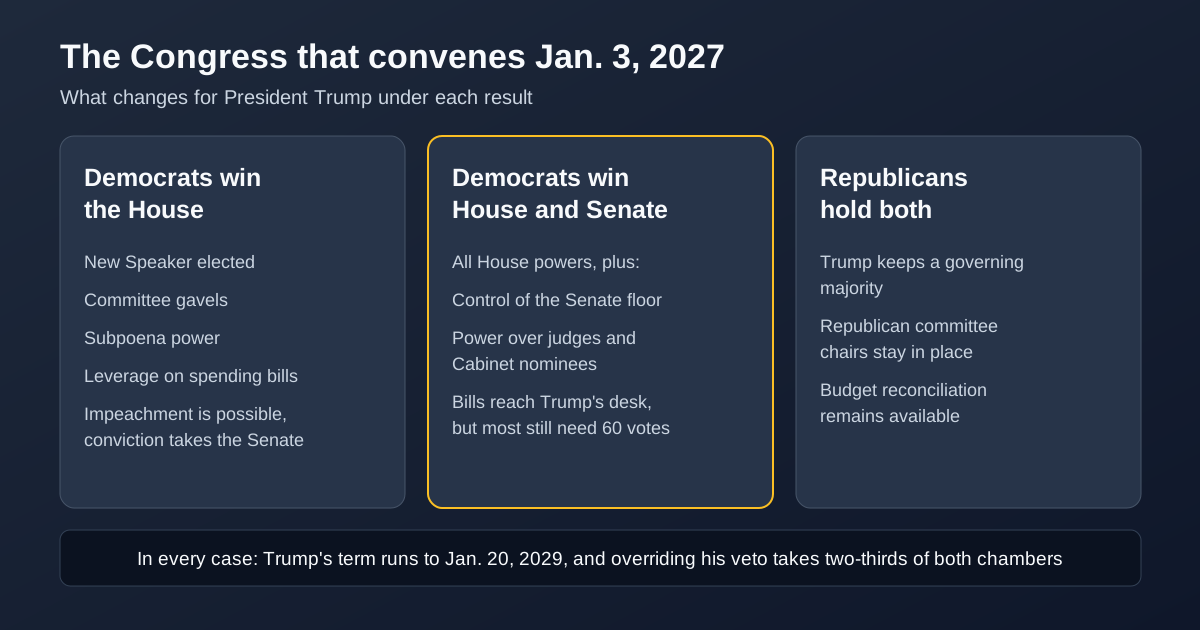
An approval rating measures opinion. Elections measure who shows up. NBC found 70% of voters rating their interest at nine or ten out of ten, with Democrats ahead by 12 points among the most engaged and Republicans ahead by two among the less interested. That gap is exactly why Trump told Fox News, "If our people vote, we win in a landslide," even as he said at the Lincoln Memorial Reflecting Pool that Republicans gave the midterms "a very strong shot." Polls also miss. The Conversation's analysis notes a wide range of Senate outcomes: if polls overstate Democrats by four points, they might gain only North Carolina, while a strong night could bring them to 55 seats plus an independent. Sampling error alone does not capture that risk. Tonight's returns and exit polls will test all of it. If you want to know what the answer would mean, read what happens if Democrats win.

Frequently Asked Questions

What is Trump's approval rating today? Averages put him near 37% to 38% approve and 59% to 60% disapprove. Individual polls from mid to late October ranged from 32% to 42%. How does it compare with Trump's approval before the 2018 midterms? Gallup had him at 44% in late October 2018. Every recent poll listed here is below that, though Gallup no longer tracks approval. How does Trump's approval compare to other presidents at midterms? Depending on the poll, it is near or below Bush in 2006 (37%) and Biden in 2022 (40%), the two lowest late-October Gallup readings in the last five midterms. Does Gallup still track Trump's approval? No. Gallup said in February 2026 that it would stop tracking presidential approval. Does low approval guarantee big seat losses? No. The direction is consistent, but the size depends on how many seats a party holds and which are competitive.

Sources

Trump approval rating midterms 2026Trump approval rating todayTrump approval rating compared to other presidentsTrump approval rating 2018 midtermsTrump approval rating among RepublicansNBC News poll Trump approval 40%Gallup presidential approval endedpresidential approval and midterm seat lossesgeneric ballot 2026
LT

LocateTrump Research Team

An independent team of developers, data analysts, and researchers tracking presidential location and activity using publicly available information from 10+ major news sources. Operating continuously since January 20, 2025. All content follows our editorial standards for source verification and accuracy.

Related Articles
Further Reading

Need deeper document-level context? Continue with carefully sourced long-form coverage.

Research Pathways for This Topic

Use these targeted internal paths to move from this article into related hubs, timelines, and data-backed tracking pages.

Explore LocateTrump

See presidential location data in action with our live tools.