Skip to content
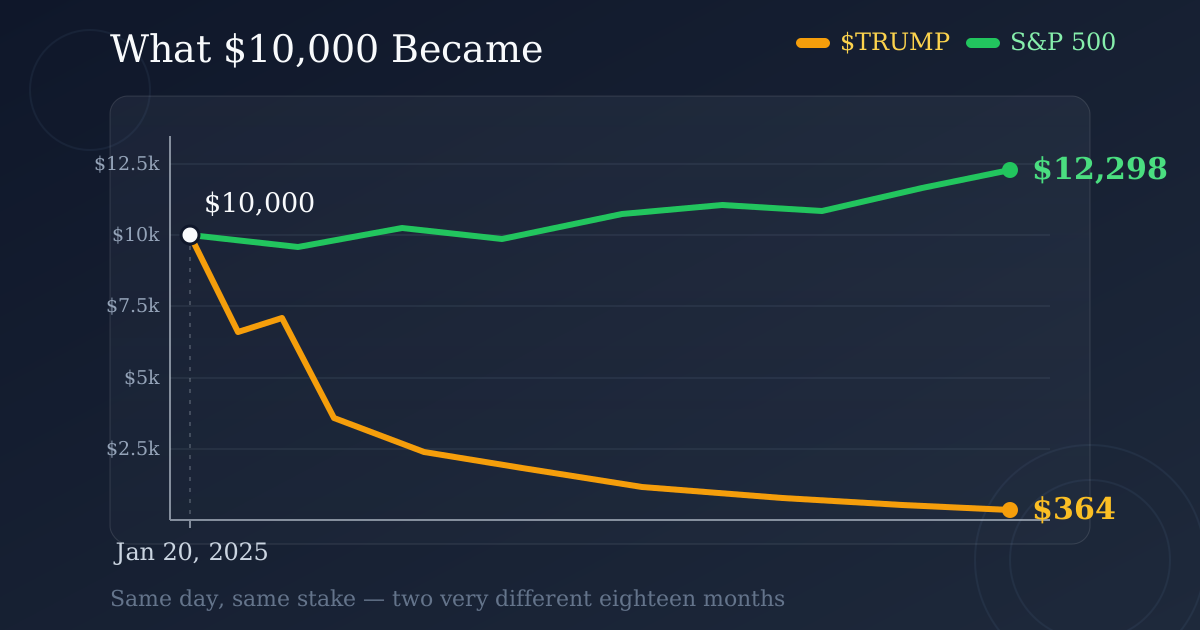
Line chart comparing a $10,000 investment made on inauguration day: Trump coin falling to about $364 versus the S&P 500 growing to about $12,298 by mid-2026
|9 min read

$10,000 in Trump Coin on Inauguration Day vs the S&P 500: The Full Math

A $10,000 bet on Trump coin at the January 2025 inauguration is worth about $364 today. The same money in the S&P 500 grew past $12,000. The full math, sourced.

The $10,000 Question

Picture two people who each had $10,000 to invest on January 20, 2025, the day Donald Trump was sworn in for his second term. One put the money into the $TRUMP memecoin, which had launched three days earlier and was the most talked-about asset in crypto that weekend. The other bought a plain S&P 500 index fund and forgot about it. Eighteen months later, the gap between those two decisions is one of the starkest in recent market history. According to Newsweek's July 2026 analysis, the inauguration-day coin buyer's $10,000 stake is worth about $364 today, while the index-fund buyer's position has grown past $12,000. That is roughly a 96 percent loss on one side of the ledger and a gain of about 23 percent on the other, from the same starting line on the same day. This article walks through the full math behind both numbers, what drove each outcome, and what the comparison does and does not tell you. For the current price at any moment, our live Trump coin tracker updates continuously, so every figure here can be checked against the market as you read.

What Happened on Launch Weekend

The launch itself is essential context, because when you bought during that first 72 hours mattered as much as whether you bought at all. The $TRUMP token went live on the Solana blockchain on Friday, January 17, 2025, three days before the inauguration. Over that weekend the price went close to vertical as traders piled in, and by Sunday, January 19, the coin printed its all-time high of roughly $74 to $75. Monday, January 20, was inauguration day, and the price a buyer paid that day depended heavily on the hour of the purchase, because the coin was already swinging hard off its peak. The buy-timing math is brutal in both directions. Someone who bought within hours of the Friday launch, when the price was a small fraction of the weekend peak, briefly sat on an enormous paper multiple. Someone who bought at the Sunday high captured no upside at all — every subsequent day has been a drawdown from that entry. The $364 figure in the Newsweek analysis reflects an inauguration-day entry, which was already well below the all-time high but still far above where the coin trades today. In other words, the famous comparison actually understates how badly the worst-timed buyers fared, and it says nothing about the small group of early entrants who sold into the weekend frenzy.

The Slide: From $75 to Under $2

From that January 2025 peak near $75, the coin's path has been a long stair-step down to under $2, a drawdown of roughly 98 percent from the all-time high. Price history archived by CoinGecko shows the pattern clearly: sharp relief rallies around headline events, each one failing at a lower level than the last. Two structural forces did most of the damage. The first is the token's unlock schedule. The overwhelming majority of the total supply was held by entities affiliated with the project at launch, with tranches scheduled to become tradable over time. Each approaching unlock date added potential sell pressure to a market that was already thinning out, and experienced crypto traders price that overhang in before the tokens ever move. The second force is ordinary memecoin dynamics. A memecoin has no earnings, no cash flow, and no claim on any business — its price is a pure function of attention and momentum. When the novelty faded and trading volume migrated to newer tokens, there was no fundamental floor to catch the decline. None of this made $TRUMP unusual as a memecoin; the trajectory rhymes with hundreds of attention-driven tokens before it. What made it unusual was the scale of the launch and who it was named after. You can see where the price stands right now on our tracker, which also charts the major legs of the decline.

The S&P 500 Side of the Ledger

Meanwhile the boring half of this experiment did exactly what index funds tend to do. Ten thousand dollars placed in an S&P 500 fund on inauguration day grew to roughly $12,298 by mid-2026, a gain of about 23 percent in around eighteen months. That stretch included genuine turbulence — tariff-driven selloffs, rate anxiety, and several drawdowns that felt alarming in the moment — but the index recovered each time because its value rests on the aggregate earnings of five hundred large companies rather than on a single narrative staying hot. The deeper contrast is compounding versus momentum. An index fund's return compounds quietly: dividends get reinvested, earnings grow, and time does most of the work. A memecoin's return is momentum all the way down — it pays nothing to hold, so it must keep attracting new buyers at higher prices merely to stand still. Momentum can beat compounding over any short window, and on launch weekend it did so spectacularly. Over eighteen months, the ranking reversed and the gap became a chasm: about $12,298 versus about $364 from identical starting stakes. Roughly a 34-fold difference in ending value is not a rounding error or a timing quirk; it is the difference between owning productive assets and renting a place in a crowd.

What the Comparison Misses

Before treating this as a complete verdict, it is worth being honest about what a clean two-line comparison leaves out. First, fees and frictions: buying a memecoin on a decentralized exchange involves swap fees, network costs, and often significant slippage during volatile stretches, so a real-world coin buyer likely started with less than $10,000 in tokens, while index funds carry expense ratios measured in hundredths of a percent. Second, taxes cut both ways — the index investor owes capital gains tax on the way out, while the coin buyer is sitting on a realized or harvestable loss that has actual tax value. Third, timing luck dominates short windows. Shift the entry to launch night and the coin side of the ledger looks wildly different; shift it to the Sunday peak and it looks even worse. The inauguration-day framing is memorable, not privileged. Fourth, survivorship framing: we are examining this particular memecoin because it crashed famously. A comparison built around an asset chosen after the fact will always carry that selection bias, and it should not be read as proof that every speculative position loses to the index. Finally, the two assets were never marketed as substitutes — one is a long-horizon savings vehicle, the other was explicitly described by its own website as an expression of support rather than an investment. The math is still the math, but fairness requires stating the frame.

How to Track It Going Forward

If this comparison is worth making once, it is worth keeping current, and that is the purpose of the tools on this site. The Trump coin tracker carries the live price, the drawdown from the all-time high, and the timeline of major price events, so the $364 figure in this article can be re-derived on any given day. Our core mission is different — the live location tracker follows where the president actually is, confirmed across more than ten news sources, and the schedule page follows where he is expected to be. We track the president's location; this page tracks his coin, and the two turn out to be complementary, because coin volatility has repeatedly clustered around presidential events that show up in the location record first. For the wider financial picture that the coin is one small part of, our net worth breakdown walks through how Forbes and Bloomberg value the real estate, the media company, and the rest of the portfolio. Checking the coin's price against that broader ledger is the fastest way to keep a single dramatic number in proportion.

Frequently Asked Questions

What if you had bought at the all-time high instead of on inauguration day? The outcome is worse than the headline number. From a peak near $74 to $75 down to under $2, the drawdown is roughly 98 percent, which would leave a $10,000 stake worth somewhere around $200, give or take, depending on the exact fill. What if you had sold at the peak? A buyer who entered near the Friday launch and exited into the Sunday, January 19 frenzy could have multiplied their money many times over in about 48 hours. The catch is that very few people did: the heaviest buying volume arrived at and after the peak, which is precisely why the average outcome skews so negative. Would dollar-cost averaging into the coin have helped? It would have lowered the average entry price compared with a single inauguration-day purchase, but averaging into an asset that falls roughly 98 percent from its high still produces a deep loss. Averaging softens timing risk; it cannot rescue a position from a collapse of this magnitude. Is the S&P 500 the right benchmark for a crypto asset? It is the standard benchmark for "what else could that money have done," which is the question most readers are actually asking. A crypto-native comparison — against bitcoin, for example — would look different, but the memecoin-versus-index framing is the one that matches how the original $10,000 question is usually posed.

Sources

$10,000 in trump cointrump coin vs s&p 500trump coin inauguration daytrump coin returntrump coin worth todaytrump business revenue comparisontrump coin all time highmemecoin vs index fund
LT

LocateTrump Research Team

An independent team of developers, data analysts, and researchers tracking presidential location and activity using publicly available information from 10+ major news sources. Operating continuously since January 20, 2025. All content follows our editorial standards for source verification and accuracy.

Related Articles
Research Pathways for This Topic

Use these targeted internal paths to move from this article into related hubs, timelines, and data-backed tracking pages.

Explore LocateTrump

See presidential location data in action with our live tools.